Since summer 2013, Google AdWords offers its users access to the paid & organic report. The report gathers data on both your SEA performances as well as on your SEO results. It allows you to discover possible synergies between these two types of results on the Google Search Engine Result Page (SERP) as it provides you with data for paid and organic results on the same queries. Therefore we decided to conduct a small analysis for one of our clients who is active in the retail industry. You’ll find our methods and conclusions below.
To get started, you’ll first need to link your AdWords account to a Search Console account. (The Search Console is a free Google Tool that helps you understand and improve on your search traffic.) Once you’ve linked the accounts (do this for all of your domains and subdomains), you’ll be able to view your organic search results alongside the performances of your text ads.
- The paid & organic report is accessible through the “Dimensions” tab in AdWords
- When you’re in that “Dimensions” tab, you can select the report by clicking on “View”
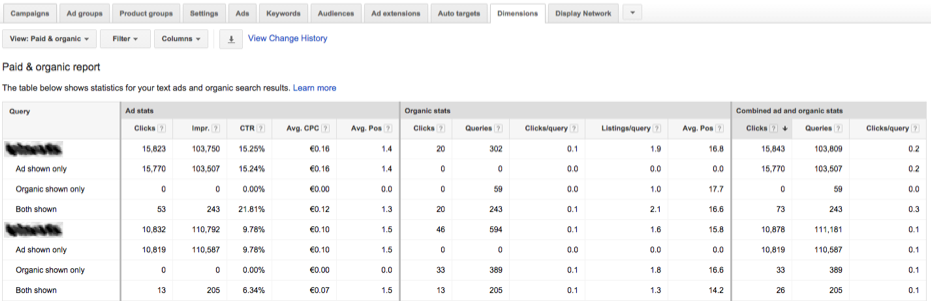
Ex. of the Paid & Organic Report
Now that you’ve located the report it’s important to us it in an optimal way to gain a maximum of insights out of it.
As you can see, the report consists out of several columns. The different columns are: Query, Ad Stats, Organic Stats & Combined Ad & Organic Stats. Each query offers different rows with statistics, showcasing three possible scenarios:
- Only the organic result was shown
- Only the ad was shown
- Both results were shown
Based on these possible ‘scenarios’, we decided to do a small analysis for one of our clients. We decided to run an analysis by placing the data in four different categories and paying special attention to the click-through-rate:
- Ad in high position & Organic result in high position
- Ad in high position & Organic result in low position
- Ad in low position & Organic in high position
- Ad in low position & Organic in low position
It’s important to note that we excluded the brand name (and variations on it) as people are more likely to click one of your results (since they already made clear a preference for your brand). For each of the described scenarios we saw, as expected (since you cover more space on the page), an improvement in overall CTR when both results were present on the SERP page.
What’s interesting to see is that the organic results always improved in terms of CTR, regardless the position on the page. At the same time we only registered an improved CTR for the ads as long as they were in one of the top positions on the SERP. As you can see on the first CTR Evolution graph there is a vast improvement CTR for the paid result when both the paid & organic result are shown in top position (+346%). At the same time we note also an improvement in CTR performance for the organic result (+16%).
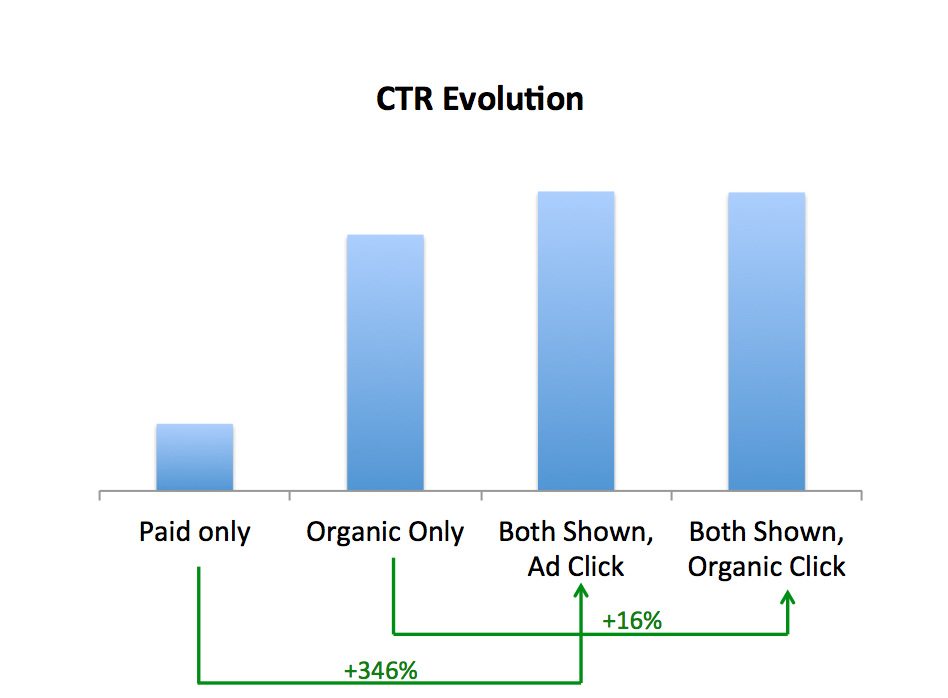
CTR Evolution for Queries for which Avg. Position SEA < 2 while Avg. Position SEO < 2
However, we see different results on the 2nd CTR Graph (below): when the organic result is in a top position, but the paid result isn’t, we see a decrease of -5% in CTR performance for the ad when both the paid and the organic result are shown. We still register an improvement for the SEO results +12%, but it’s smaller than in the scenario above.
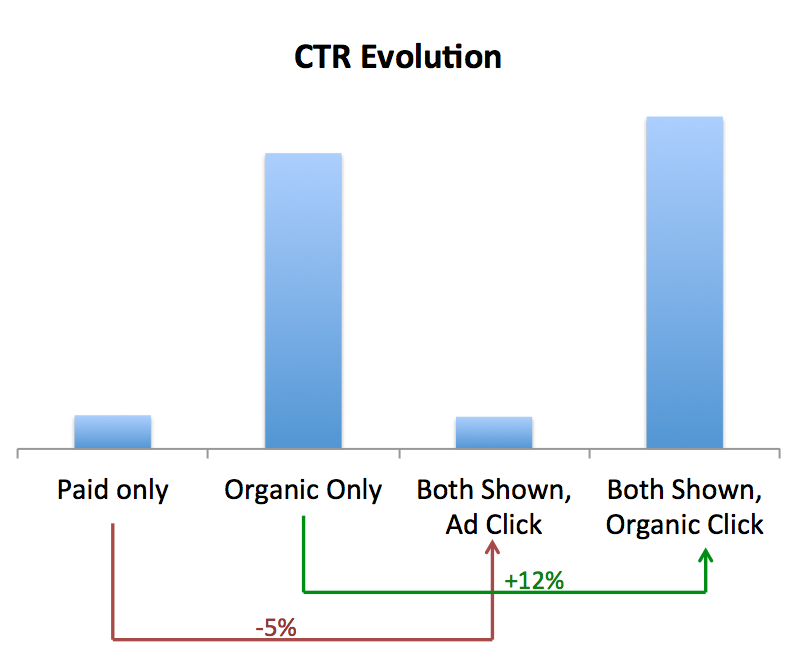
CTR Evolution for Queries for which Avg. Position SEA < 2 while Avg. Position SEO < 2
So, what are the key takeaways we can draw from this analysis?
- Always try to be present with two results on the SERP so you should aim to improve the Search Click Share on your keywords, especially on your top converting keywords.
- Try to improve your Avg. Position for the keywords with a low position, both your paid and organic performances will benefit from it. For instance, identify the keywords that match the above keywords segmentations by using the filters in the paid & organic report and tag them with a label. This way you can control the scope of your experiment and its budget. The label allows you to easily monitor the performance evolution of the selected Keywords.
- If you’re trying to improve your SEO, it’s worth to take a look at the queries for which you rank high organically and compare those landing pages to the ones that match queries for which you appear in lower positions. Is there any specific content (extra reviews, product/service descriptions, pictures, etc.) on these pages that might get the favour of search engines?
- If you’re trying to improve on your SEA, it’s worth to take a look at the queries for which you rank high organically and low for paid results. Go for a boost on these low performing SEA keywords to benefit from a global improvement in CTR on both search results (SEO/SEA).
- Obviously, do not forget to consider the competition when doing such an exercise!
Author: Vincent Saelen