Building a Customer Data Infrastructure through Segment sets you up with a data pipeline that’s able to take data to a multitude of applications downstream. The quality of that data as well as the potential the data holds is tied directly to the quality of your technical specification as well as the quality of the implementation of that spec. We’ll share 4 ways on how you can verify an implementation in order to be able to verify, validate & debug the spec and its implementation to ensure an impeccable implementation.
1. Debugger
The first method simply uses Segment’s built-in Debugger functionality.
This provides an overview of the events that are being sent to Segment by a specific source. Simply trigger the different events and watch them come into Segment using the Debugger.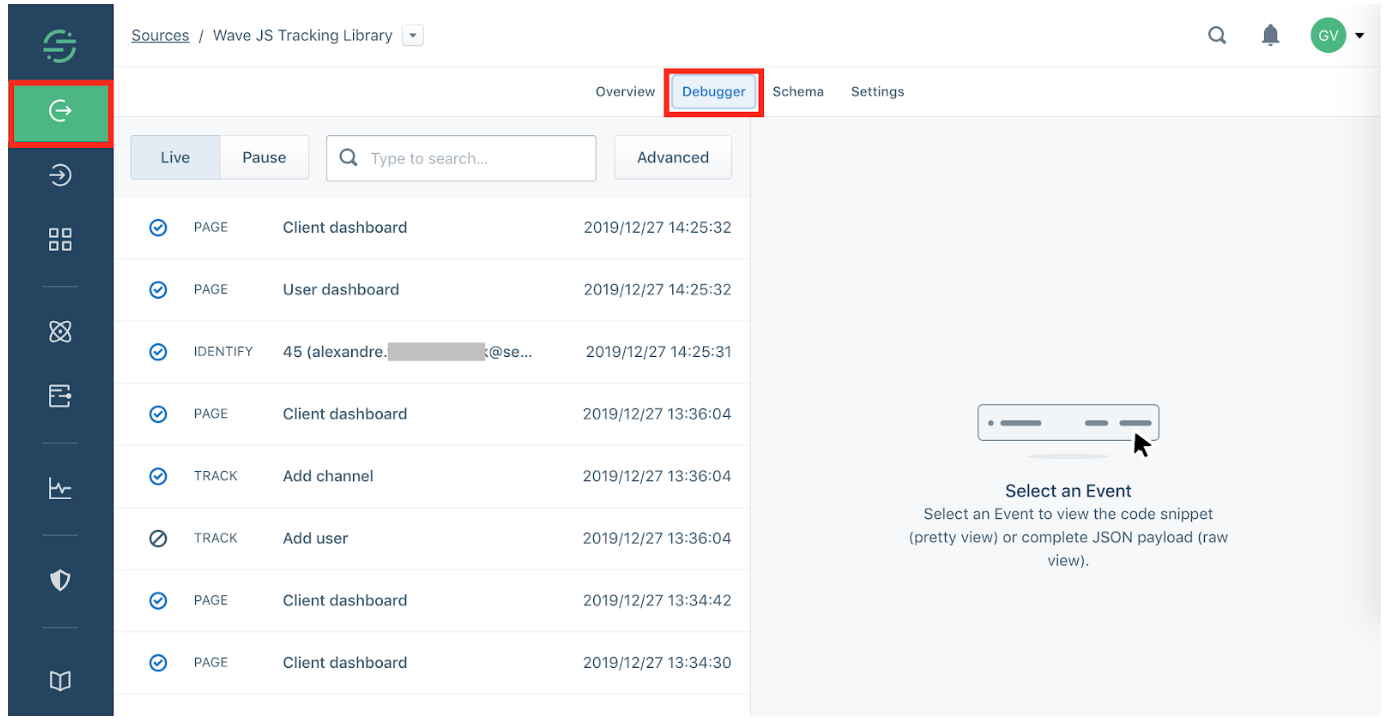
2. Network tab
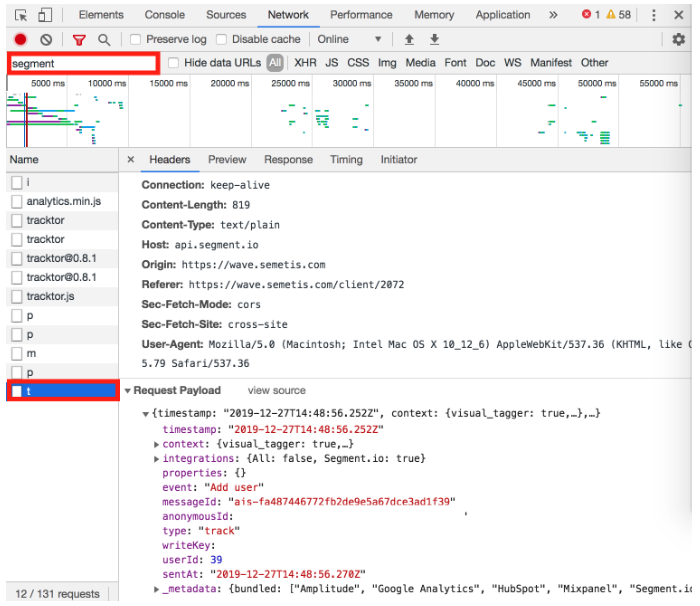
Right click in Chrome & select inspect. Navigate towards the “Network” tab.
Type “segment” in the search box. You can find the Segment calls here as they occur.
Simply trigger the different events and watch them being sent to Segment through the network tab.
Example of an identify (i) call: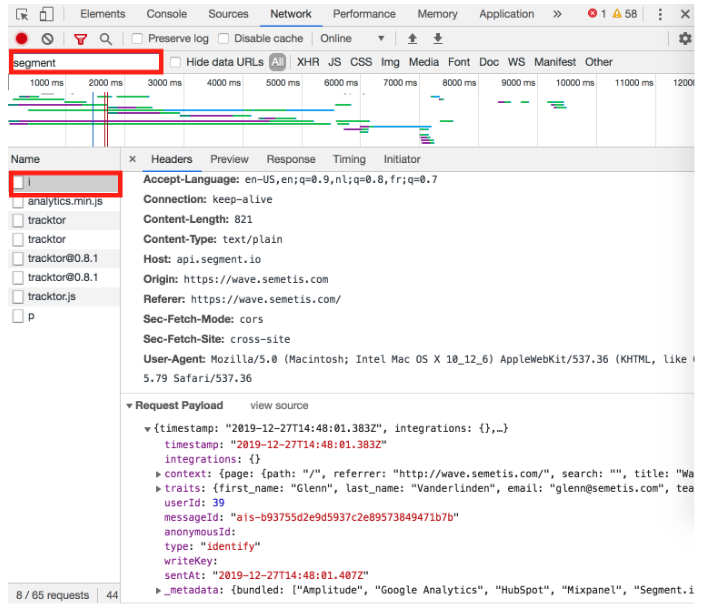
Example of a track (t) call:
More information regarding the statements can be found on the Segment help portal.
3. Console
Right click in Chrome & select inspect. Navigate towards the “Console” tab.
Type the following command:![]()
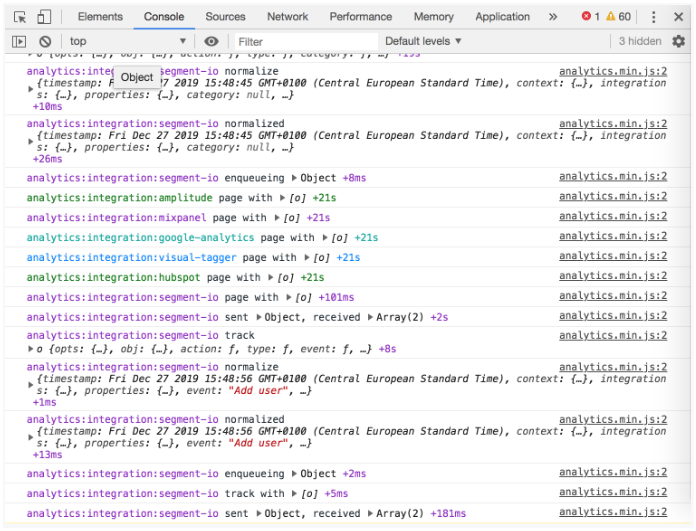
The console will start logging all of the interactions with Segment. Simply trigger the different events and watch them being logged into the console.
To stop the console from logging these run the following command:![]()
4. Plugin
A fourth and final way to debug Segment is by using the Segment extension.
Simply trigger the different events and watch them being logged into the plugin’s pane.
![]()
![]()
The following tools should be able to help you verify, validate & debug your current Segment setup.

Glenn Vanderlinden
| LinkedinThis email address is being protected from spambots. You need JavaScript enabled to view it.