Client Overview and Challenge
The Skateroom, a B Corp Belgian-based company, became known worldwide for placing famous works of art on responsibly made skateboard decks that can be displayed as art in our homes. The Skateroom believes that for-profit companies share a moral obligation to use their power for the greater good. With a growing environmental, humanitarian, and economical crisis, the modern world requires sustainable solutions to conducting business.
After having assisted The Skateroom with the configuration of their website tracking (Google Analytics) we identified a consistent drop-off happening in the checkout. We flagged two potential bottlenecks:
- Nearly half of the visitors, after initiating the checkout, drop out of the funnel before completing their personal details
- 2 out of 3 users does not finalize their purchase order after filling out their personal details
These numbers show that people were struggling in closing down their purchase, making The Skateroom missing out on a significant number of potential transactions in the longer run.
The approach: Conversion Rate Optimization (CRO) via Google Optimize
In order to improve the success rate of purchases made by these users, we started a Conversion Rate Optimization (CRO) project where we planned to optimize the blocking points in this checkout funnel. The objective of the project is to drive potential customers more efficiently through the funnel and having an impact on the bottom line: business revenue.
First, an in-depth analysis of the visitor’s behavior going through the website and the checkout flow was made in order to identify bottlenecks. The focus was on both the checkout funnel and the pages leading to the initiation of the flow in order to pinpoint blocking factors in the funnel itself, but especially also before entering the funnel. In the second phase, all the identified bottlenecks were mapped on a testing roadmap and further assessed based on their scale of impact, timing and resources required before assigning priority levels for testing.
1. Analysis of checkout flow performances
In the analysis conducted, we made extensive use of three tools to be able to identify the bottlenecks. These tools were the following:
- Google Analytics: At first the tool was used to spot bottlenecks and significant drop-off points. Secondly, Google Analytics was used to highlight the impact of device usage on those blocking points. The quality of both desktop and mobile pages was assessed by examining their page performance on factors such as exit rates, time spent on pages and the site speed performances.
- Hotjar - Heatmaps: Allowing us to identify where people interacted (clicked) with our website on both desktop and mobile.
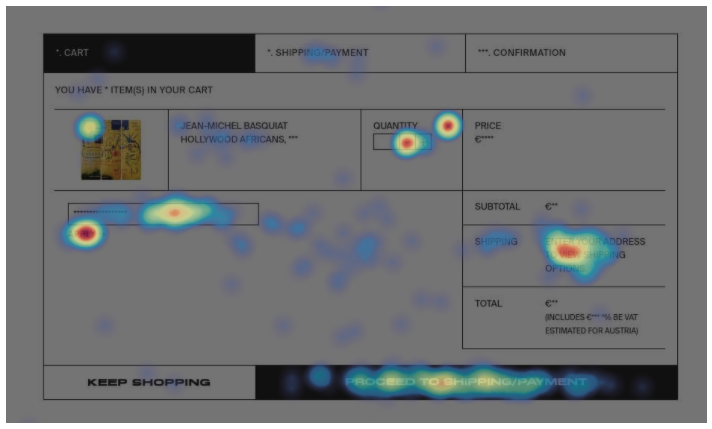
Concrete example of use: As The Skateroom’s ecommerce website delivers worldwide, we noticed that a lot of people were trying to calculate their shipping costs on the cart page. Which as we knew from the beginning was one of the major drop off points. Yet, the text under shipping is actually not clickable which led to frustration and in turn causing people quitting their purchase process.
- Hotjar - Feedback polls: We actively made use of the feedback polls on the website allowing us to gather user feedback focusing on information that was missing, information that was unclear, and which experiences/pages were slow and blocking user experience (See image 4). In addition, we allowed users to comment on what precisely they found blocking. (See image 5)
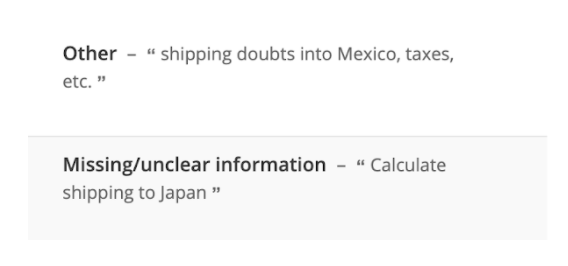
Concrete example of use: From those feedback forms it became obvious the information around shipping details was not clear as user were doubting how many days it would take and what the cost would be.
2. Creation of testing roadmap and plan
In a first instance, we assessed different A/B testing tools that would allow us to run any tests on the website in a fast, efficient and cost effective way. Multiple tools were assessed but in our case the choice went to Google Optimize as The Skateroom is already present on the Google tool stack using Google Analytics and Google Tag Manager for both analytics and tagging needs. In a second instance, based on the outcome of the bottleneck analysis, a priority level was set on each of the tests based on different factors such as:
- Complexity of the test variation creation: High - moderate - low scale used to identify how complex a test is to set up. This level was assessed based on the aggregation of time and resources required to do the implementation.
- Overlap testing on the same page: In order to achieve the most accurate test outcome, we considered not to run multiple tests on the same page at the same time. This isolates the testing to happen on one variation test and removes potential influence of another test.
Based on the phase 1 analysis, 12 tests were identified and documented. This was then afterwards further translated into the testing roadmap which is still in current use by the team to continue improving the overall flow of people towards purchase.
The implementation
In the setup of the test variations we opt to highlight 1 test out of the test roadmap to elaborate on. However, the implementation of experiment variations has been done for the vast majority of the test as was defined in our testing roadmap. The test in our case looked deeper into the clarification of shipping information during checkout. A short summary of the test can be found here below.
- Challenge: In this test, based on the results of the hotjar feedback polls and user heatmaps we noted that people were having questions on the shipping details. Here it was not always clear how long it would take for an order to be send out and how long it would take (days) to arrive to its destination.
- Objective of the test: To clarify the shipping information in order to improve the finalisation of purchases made. This by adding detailed info on the average shipping and delivery timing into the shipping/payment step.
- Variant put in place: The variant adds an extra information text block, here below displayed in the orange box, whereas before there was only the text available directly to the right of the orange box (“Enter your address to view shipping options”) which can be seen in the 2nd image.


Results & Business Insight
The results of this A/B test were seen to be quite successful as, with statistical significance, we could say that by providing extra information on the shipping details:
- Modeled improvements on transaction volumes were seen to potentially go up by 36% to 289%
- The modeled percentage of people finalising their purchase from the shipping and payment page went up by 91%
Thanks to the success of the Google optimize experiment, we saw that our modeled conversion rate went up by 91% during the testing period. This of course impacted the bottomline business and revenue which is the most direct impact that we can generate with the experiment. Based on this positive outcome of the test, the extra information has been put in place on the page of the checkout step permanently.

Jeroen Cools
| LinkedinThis email address is being protected from spambots. You need JavaScript enabled to view it.