
1. Introduction
Some say code is eating the world, others say it’s data that’s eating our planet. Whatever the perspective, one thing is for sure - API’s are at the center of it all.
API’s or Application Programming Interfaces allow third party applications to interact, communicate and pass information back and forth between applications. In our example we will be using the Google Analytics API in order to access Google Analytics data through R Studio. R Studio is basically an IDE (Integrated Development Environment) for the statistical programming language R. IDE’s typically are more user-centric and allow programmers or analysts to facilitate their interactions with the programming language itself. In the case of R Studio the IDE provides a clear overview of the packages you have at your disposal, a clear split between the different environments is provided and a difference between the script field and the console. These are only a few examples of R Studio’s capabilities.
Now that you know what R Studio is about a more important questions might come up. Why would you even use a complex programming language if Google Analytics already provides a clear user interface? Let’s list a few elements that state why using an API in combination with R can be an advantage.
- The risk of making errors while gathering data is reduced. As all data gathering is automated and happens through a machine (computer) no human interaction is needed. This means that the risk of making errors while gathering or duplicating data is reduced.
- Calculating new metrics (based on large volumes) becomes increasingly easier in R (or any other language for that matter). Adding a column in a dataframe from 300.000 lines is fairly easy. Trying to do this in Excel is often more difficult.
- R allows data transformation through a variety of packages or built in functions. One example would be transforming date formats.
- R makes it easy to visualise large amounts of data. Available packages are for instance ggivs or ggplot2.
These are merely the advantages of using an API from our perspective. Applications such as Additionly and How We Browse use all kinds of API’s in order to request data and store it in their own database systems for further processing.
Throughout this article we will help you create your first API queries using R. Therefore two main elements need to be addressed. First of all we need to request access through the API. Once this has been completed we can start building our query.
2. Obtaining API credentials
In order to access the Google Analytics API you will need to create a Google Developer account. The following steps will guide you through this process. Please note that this procedure only grants you access to the Google Analytics accounts, properties and views you have access to.
- Visit https://console.developers.google.com and sign in or create an account if you do not have one.
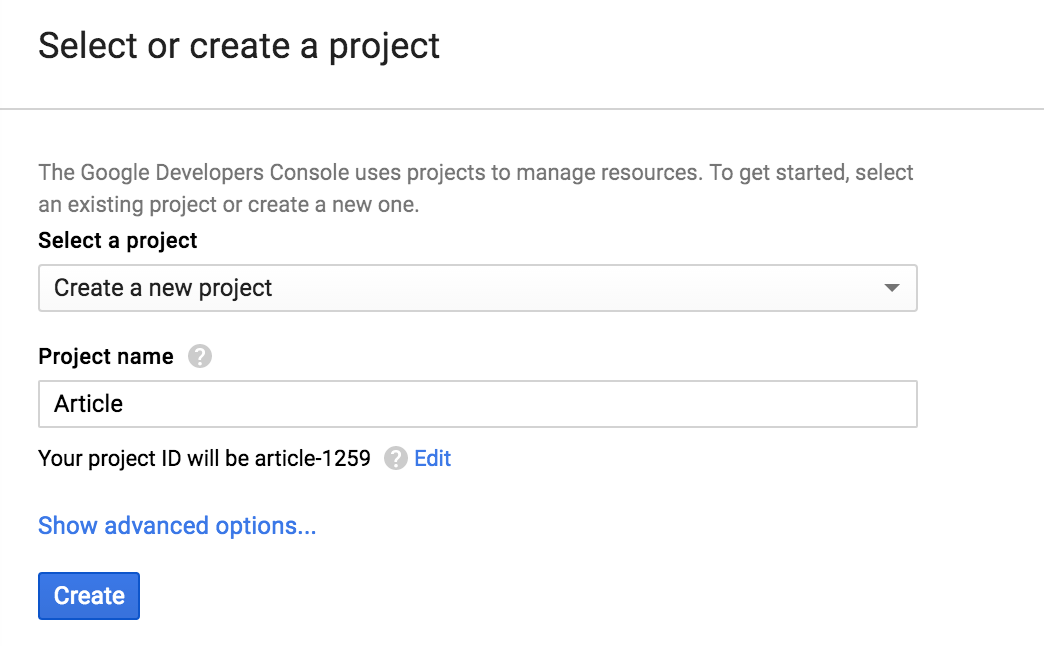
- You will be asked to create a new project
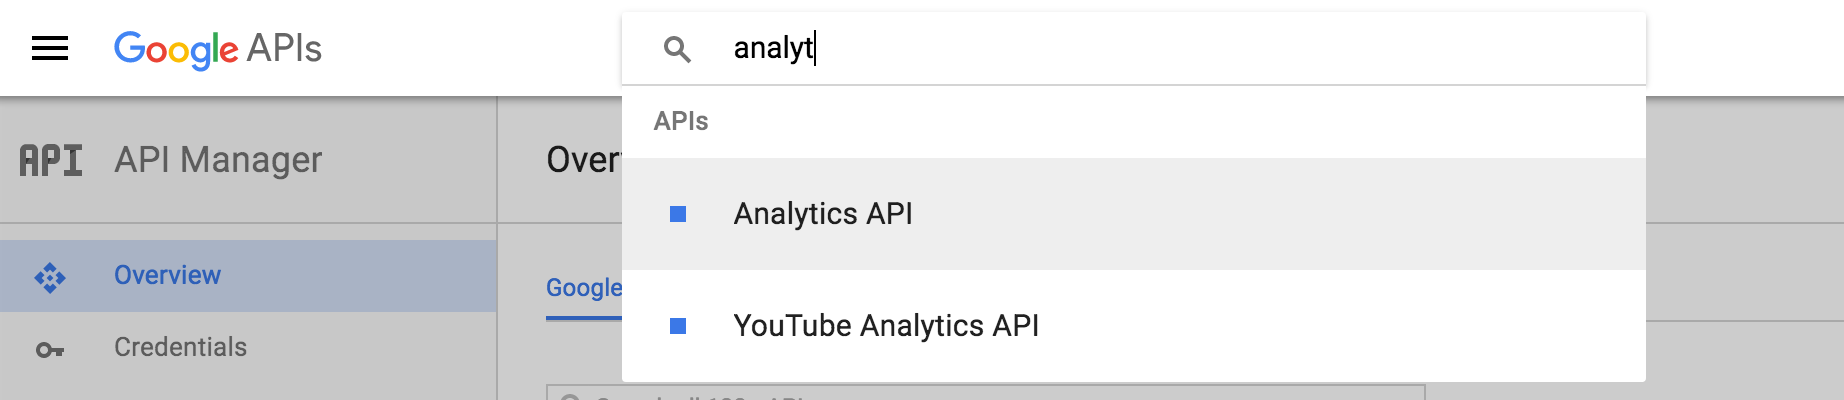
- Look for “Analytics API” in the search bar
- Enable this API for your project by pressing the “enable” button.
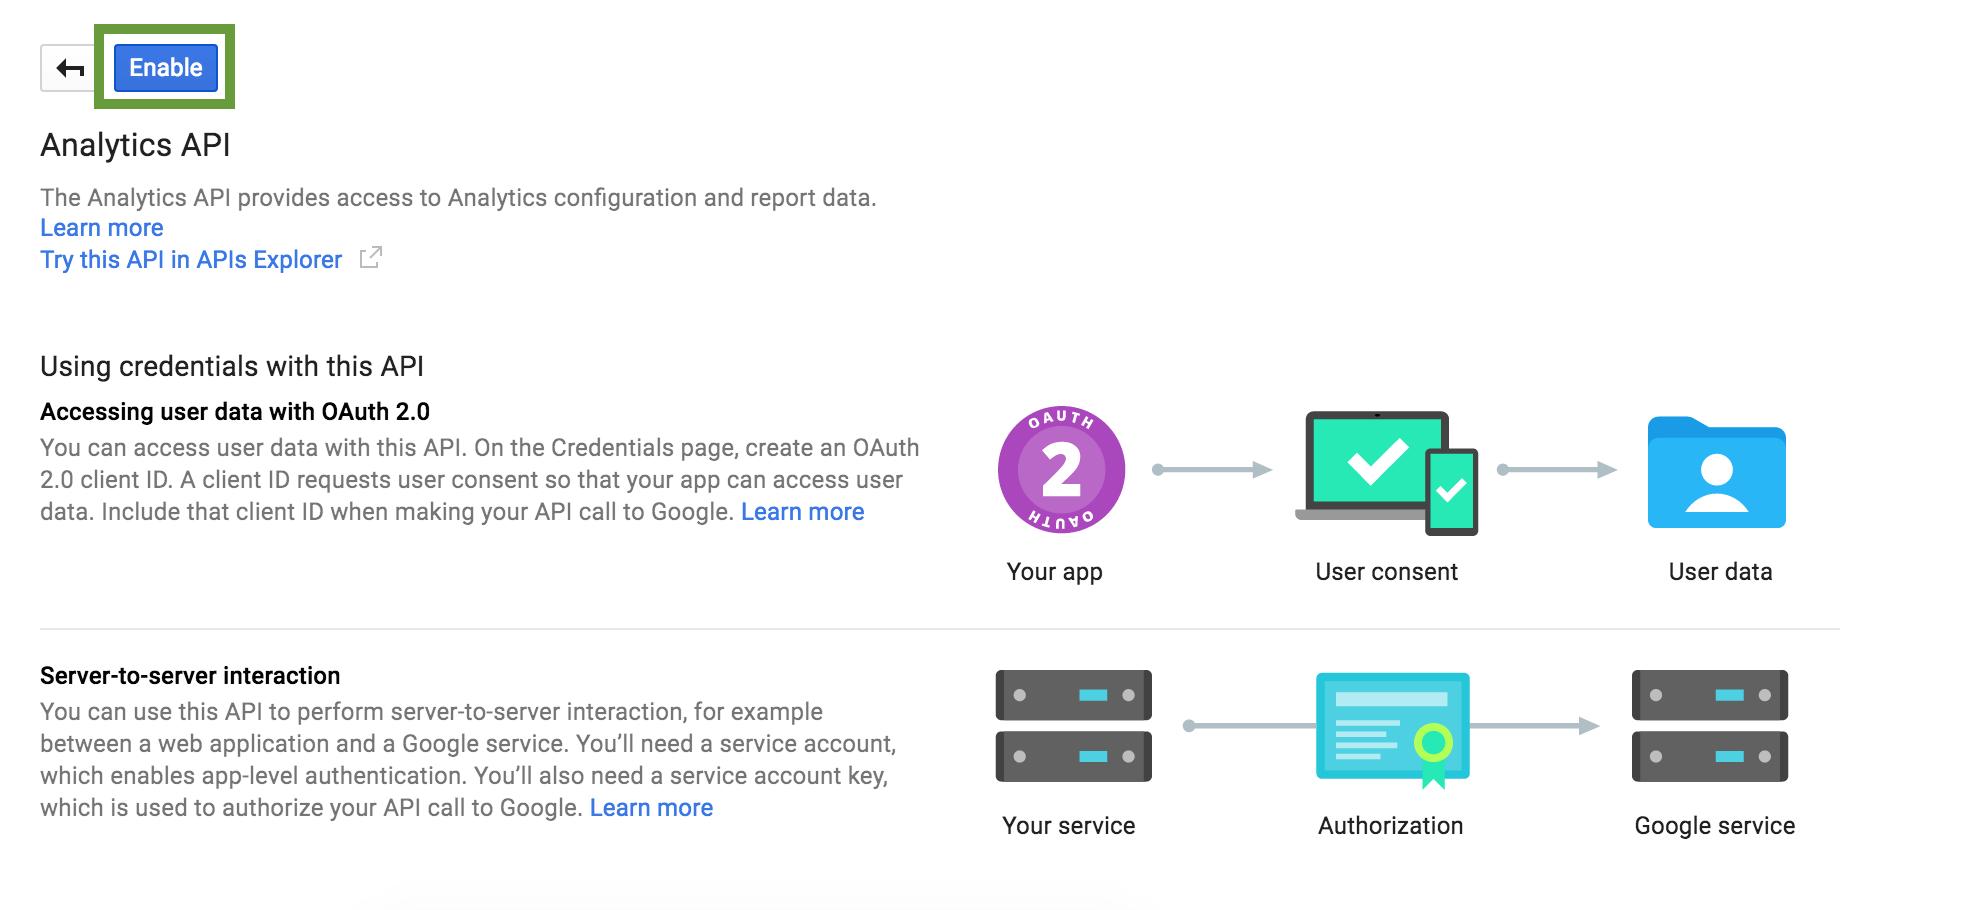
Note that this page mentions which credentials you’ll be needing to use this API. “Accessing user data with OAuth 2.0”.
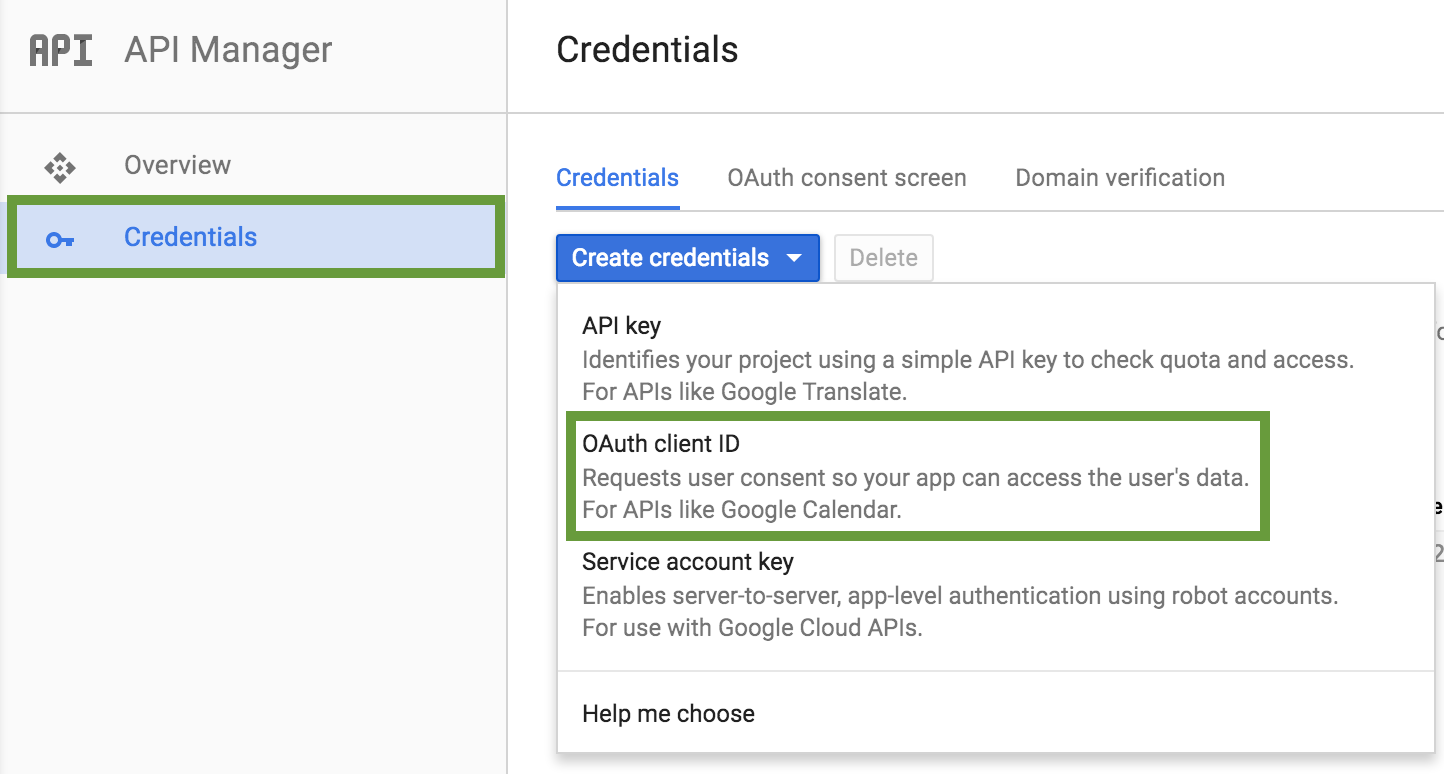
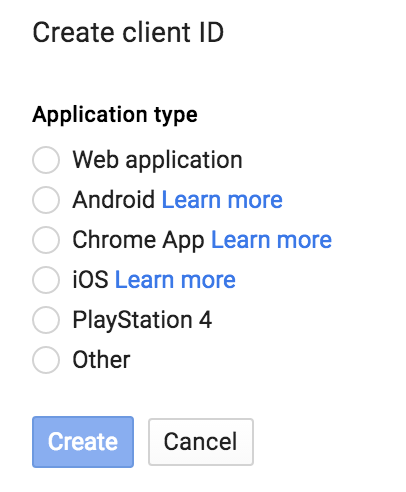
- Head for the credentials tab on the left hand side and select “Credentials”. Next select “OAuth client ID” from the “create credentials” drop-down menu.
- A selection menu will be shown. In our case the radiobutton “other can be checked”.
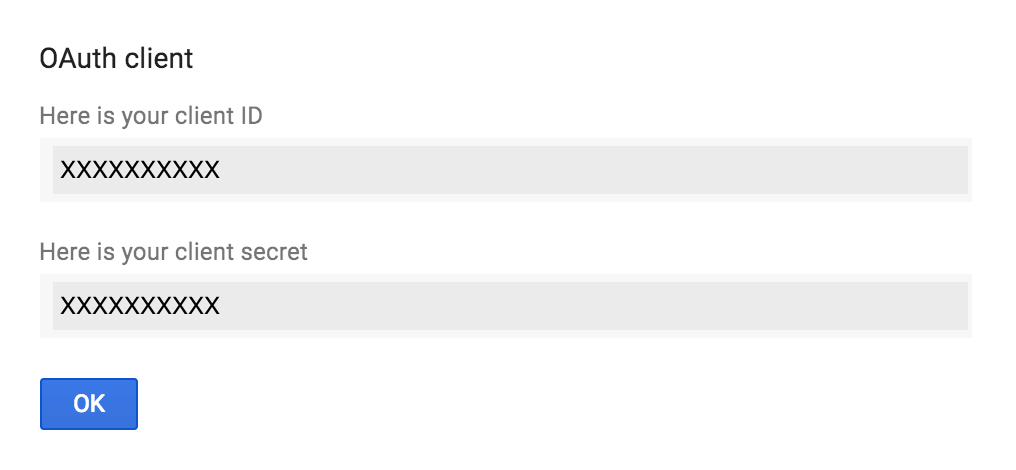
- Congratulations, you have now obtained your authentication details!
- Extra - Lost your client secret? Click the download button at the end of your credential line within the credentials tab.
![]()
A JSON file will be downloaded. Open it with a text editor and look for the field "client_secret".
3. Setting up the code in R Studio
Now that we have all authentication credential you are ready to start querying the API through R Studio. The code consists of three main parts. The first part will help you to install the necessary packages.The second part revolves around the actual authentication. The final part will contain the actual queries.
Lines starting with #indicates comments and are inserted to guide the user through the code.
1. Packages: In order to use some of the authentication functions you will need a specific package called “RGoogleAnalytics”. The following code block will help you to install the package and activate it.
|
#Loading package install.packages("RGoogleAnalytics") library(RGoogleAnalytics) |
2. Authentication: This code block clears your access to the API and ensure you are able to fetch the necessary data points.
|
#Authentication #Insert the client id retrieved from the Google developer #console client.id <- 'XXX'
#Insert the client secret retrieved from the Google developer #console client.secret <- 'XXX'
#Find the view ID in the view setting page of your Google #Analytics view you wish to query view.id <- "ga:XXX"
#This code block verifies if the token has been created #during a previous query. If so it will reuse it. if (!file.exists("./token")) { token <- Auth(client.id,client.secret) token <- save(token,file="./token") } else { load("./token") }
ValidateToken(token) |
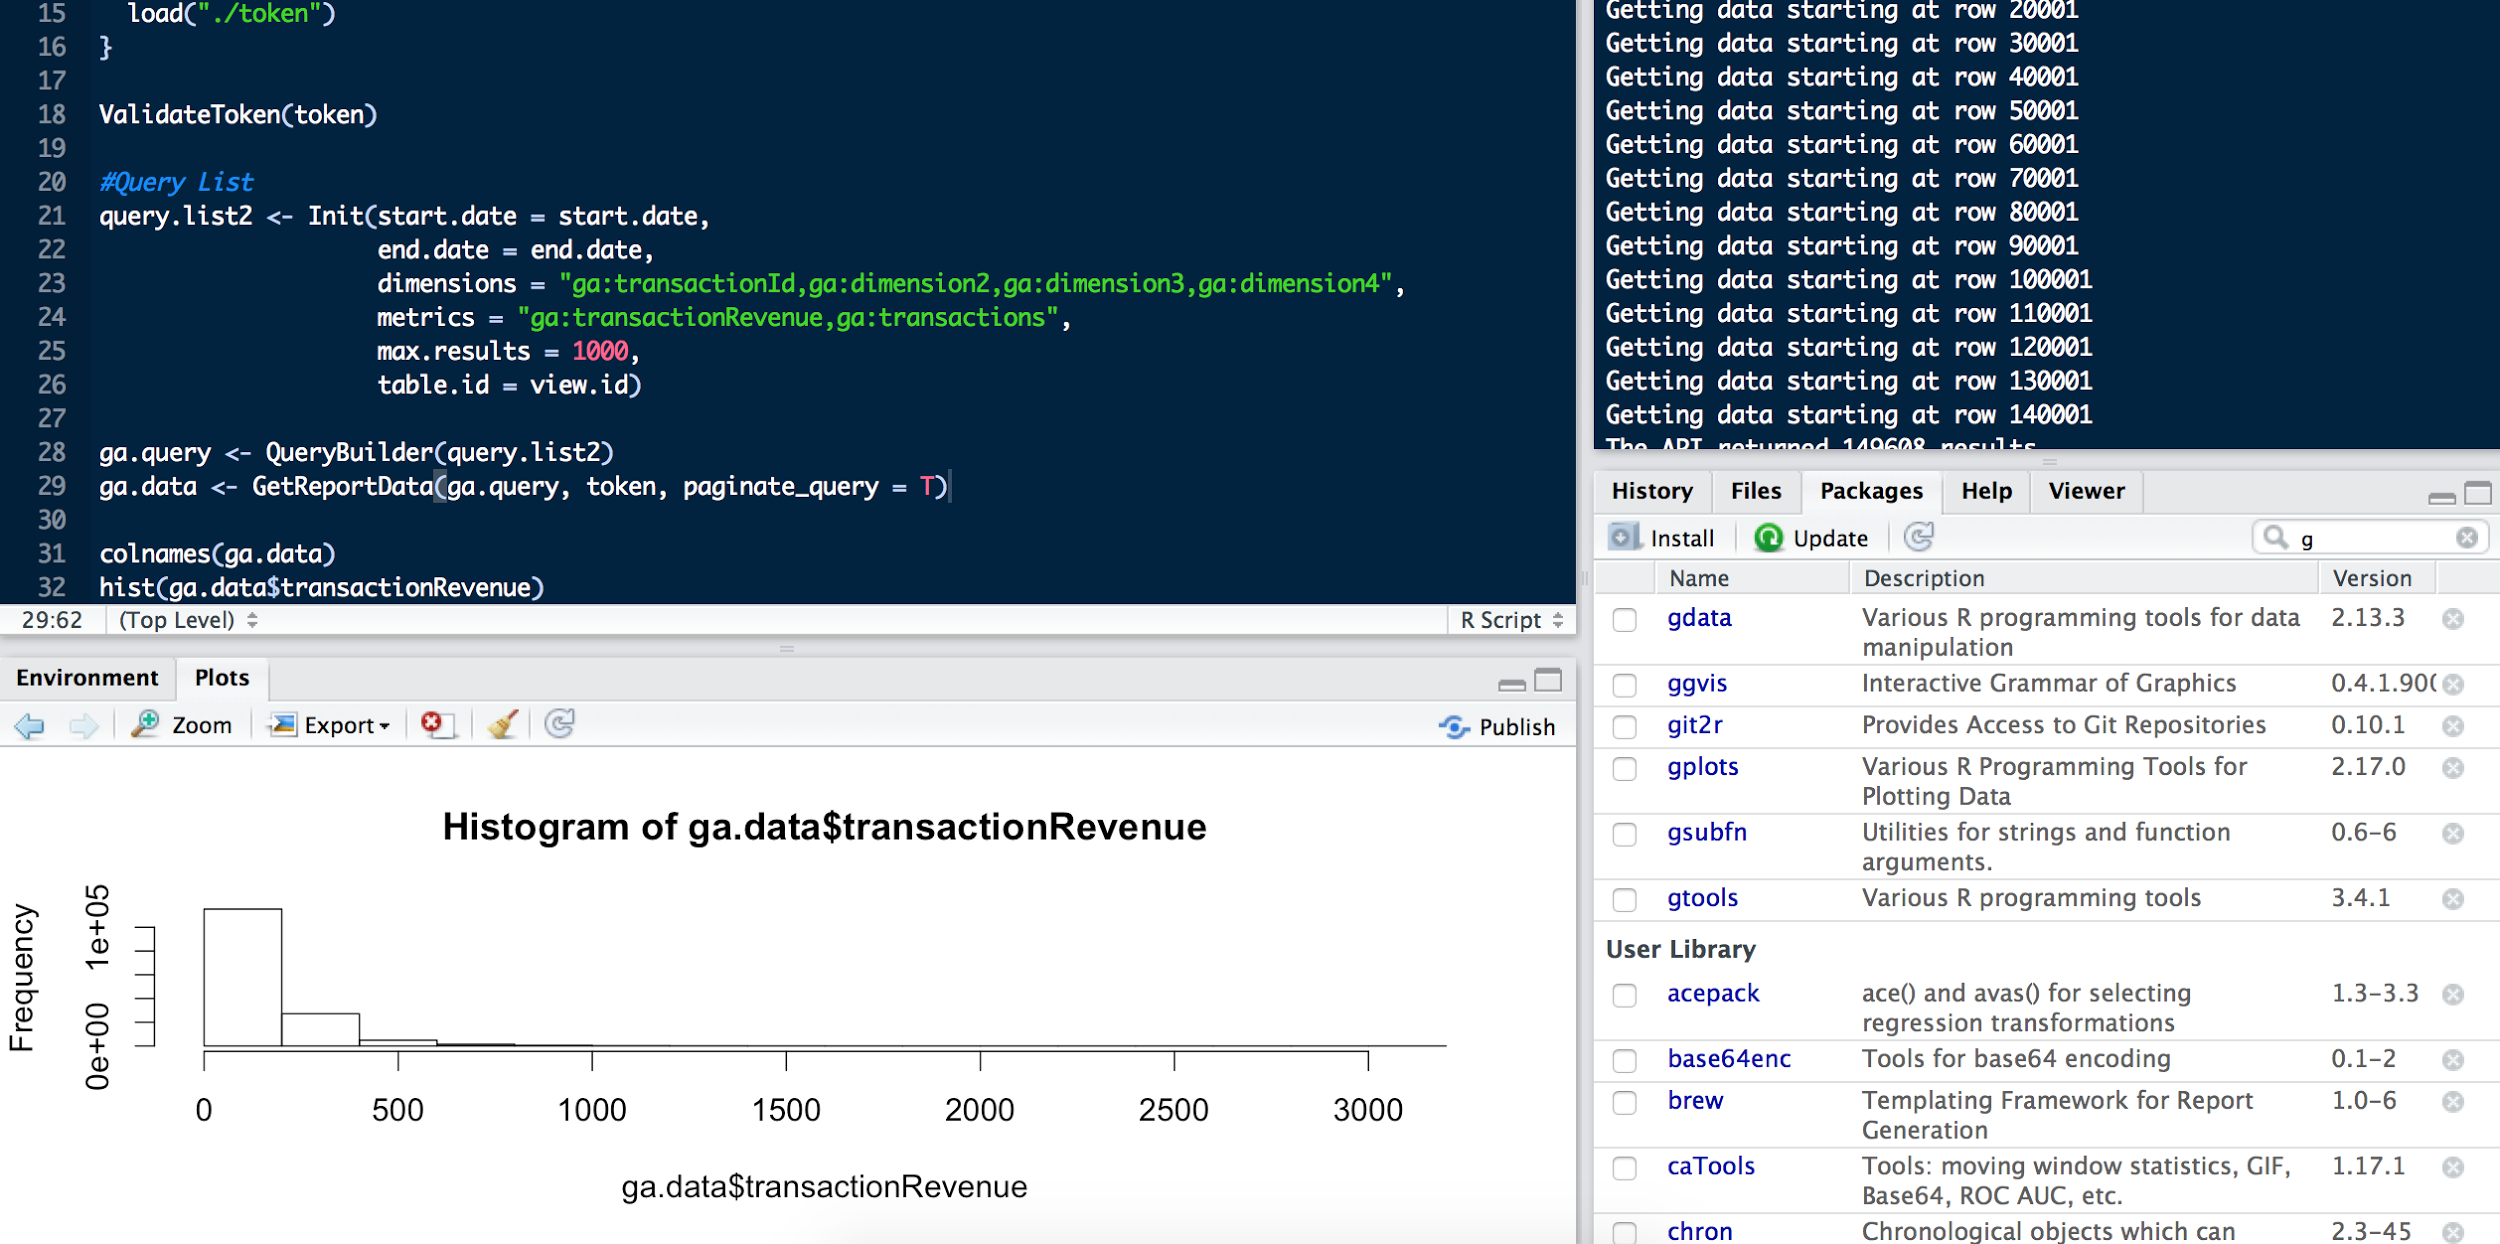
3. Query building: This section will allow you to build you custom queries using the fields “metrics” and “dimensions”. Use the Google developer metrics and dimensions explorer to create the combination of data points your analysis requires. Note that not all theoretical combinations are available as some data points can not be crossed.
|
#Query List #Example given on dates query.list2 <- Init(start.date = start.date, end.date = end.date, dimensions = "ga:transactionId,ga:dimension2,ga:dimension3,ga:dimension4", metrics = "ga:transactionRevenue,ga:transactions", max.results = 1000, table.id = view.id)
ga.query <- QueryBuilder(query.list2) ga.data <- GetReportData(ga.query, token, paginate_query = T) |
Author: Glenn Vanderlinden